 I’ve been busy developing a Covid-19 predictive model using R Studio’s Shiny development environment. This project started as a way of informing myself of what might be happening locally but subsequently grew wings.
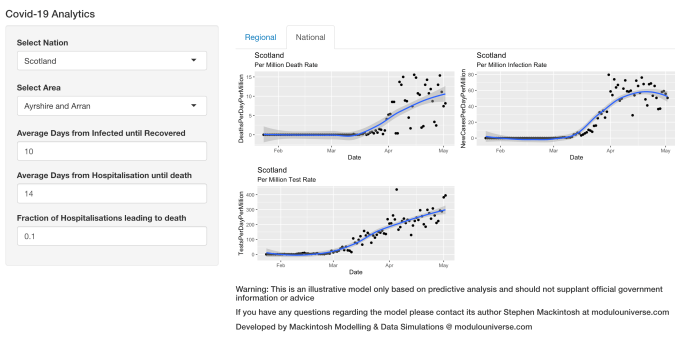
It’s using UK and Scottish gov. data on infection rates to make predictions of likely infection levels within various health service regions. The concept of recovery is built into the model as a way of measuring residual levels of infectivity within a population. A user can supply the geographic region as well as change model parameters and assumptions about how the virus is impacting a health system
It’s still at a fairly basic stage and more is being added weekly. National metrics on testing rates have recently been implemented, for example.
If you’d like to sample the app please get in touch and I’ll send you a link. With the help of colleagues I’m in the process of securing a permanent server to deploy the app onto so I can share the work more widely.
Developed by Mackintosh Modelling & Data Simulations.